Rating:
Let's open the given wav file with Audacity:
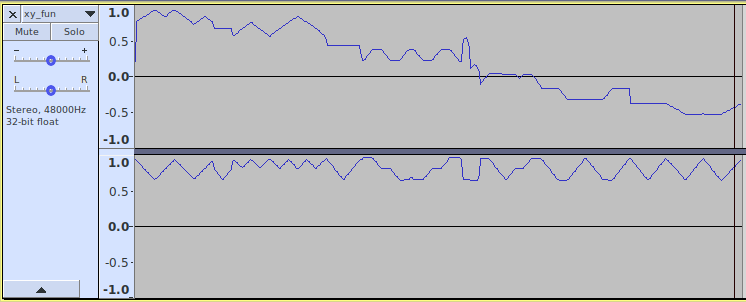
Well, nothing interesting.
But the task name sounds like xy_fun... function... y(x)..
Ok, what if we try to plot the image considering audio samples as coordinates?
WAV is an uncompressed format, so the audio samples performed simply as numbers:
```
wav file = [44 byte wav header][raw audio samples...]
```
where
```
[raw audio samples] = [LRLRLRLRLRLR...]
```
L and R are numbers for left and right channels respectively.
Let's write python script to extract the samples:
```
import struct
b = open('xy_fun.wav', 'rb').read()[44:] #omit first 44 bytes
raw_bytes = [struct.unpack('h', ''.join(b[i : i+2]))[0] for i in xrange(0,len(b), 2)]
with open('wav_to_draw.txt', 'w') as file:
i = 0
while i < len(raw_bytes):
file.write(str(raw_bytes[i]) + ' ' + str(raw_bytes[i+1]) + '\n')
i+=2
```
Now ```wav_to_draw.txt``` file looks like this:
```
6333 31004
25467 30273
25873 29579
... ...
```
Let's plot it! I used gnuplot for this.
```
$ gnuplot
G N U P L O T
Version 5.2 patchlevel 2 last modified 2017-11-01
Copyright (C) 1986-1993, 1998, 2004, 2007-2017
Thomas Williams, Colin Kelley and many others
gnuplot home: http://www.gnuplot.info
faq, bugs, etc: type "help FAQ"
immediate help: type "help" (plot window: hit 'h')
gnuplot> plot "wav_to_draw.txt"
```
The output image was mirrored. Afted mirroring it back I finally got this:

And the flag is: ```AFFCTF{XY_1S_FUN}```


