Rating:
# The Challenge
The download is an archive with a readme and a text file. In the
readme we get a bit more information about the challenge:
> This archive contains a sanitized execution trace of:
>
> `./flag-hunting-bin FLAG.txt`
>
> The trace is for debugging purpose only.
> The address of each instruction has been replaced with a unique
> identifier and our secure technology ensure that no data can be
> recovered from this trace.
>
> -- The OOO Secure Tracing Department
The text file is an execution trace of the flag-hunting-bin, but it only
contains an obfuscated program counter, and the disassembled machine
instruction. No memory contents, no register contents. The first few
lines look like this:
```
3cda655ffeabac454f0ddeffbd60f3f3 mov r9,rdx
be8924b72ff3c6befe76ff77d13fe361 pop rsi
7bca8934003b83d64e73593c937f9a76 mov rdx,rsp
99a1ff7893c9a395d1331f630be96516 and rsp,0xfffffffffffffff0
bac8c7972748dded67677f6b80477780 push rax
7b00642b2afad3cf82d044a0a03ecf16 push rsp
```
The objective is clear: we have to obtain the flag from the execution
trace, by inferring values from branches. But since we are lazy, we use
tools for this. First of all, we transform the text trace into
something more useful, and load it into TRCView. Since most people
probably never heard about TRCView, a quick explanation about the tool.
# TRCView
[TRCView](https://github.com/pekd/vmx86) is an open source interactive execution trace analysis tool. It
is architecture agnostic, so it can be used to analyze traces from all
kinds of different architectures. It even supports a *generic* trace
file format, which encodes information about the architecture in the
file header. This is exactly what we will use for the flag-hunting
challenge.
When loading an execution trace, TRCView reconstructs the memory
contents for every point in time, tracks register values, and parses the
instruction trace into a tree, where every level corresponds to a
subroutine. This makes it convenient to analyze individual subroutines,
without being overwhelmed by all the instructions from nested calls.
Since our execution trace only consists of obfuscated program counter
values and decoded machine instructions, we use the generic trace file
format. Every instruction gets a "step number", which is the line number
in the original trace - 1. Since the program counter for TRCView has to
be at most a 64bit integer, we just generate new program counter values
using the hashes. Generic trace files need information about the
instruction types, so we parse the instruction mnemonic and assign the
instruction type to every parsed instruction. The instruction type tells
TRCView if it is looking at a jump/call/return/conditional
branch/syscall/...; as machine code we just use the original obfuscated
program counter value.
The main features of TRCView for analyzing the trace file of this
challenge are subroutine names, comments, and instruction coloring. By
renaming subroutines, we can easily understand what we are looking at,
by adding comments, we can understand what the program code does, and by
coloring instructions, we can quickly see loops and branches.
# Analyzing the Trace
After loading the converted trace file into TRCView, we immediately see
the first few instructions of the program.

The first call seems to go into the standard libc initialization
function, which then calls the program's main function with an indirect
call (`call rax`), followed by a call to `exit` with the value returned
by `main`. The main function therefore starts at instruction 214 (line
215 in the original trace file).
We can also see that many syscalls are performed over the program run.
The first step now is to look at every syscall and annotate it with its
name. For example this syscall:
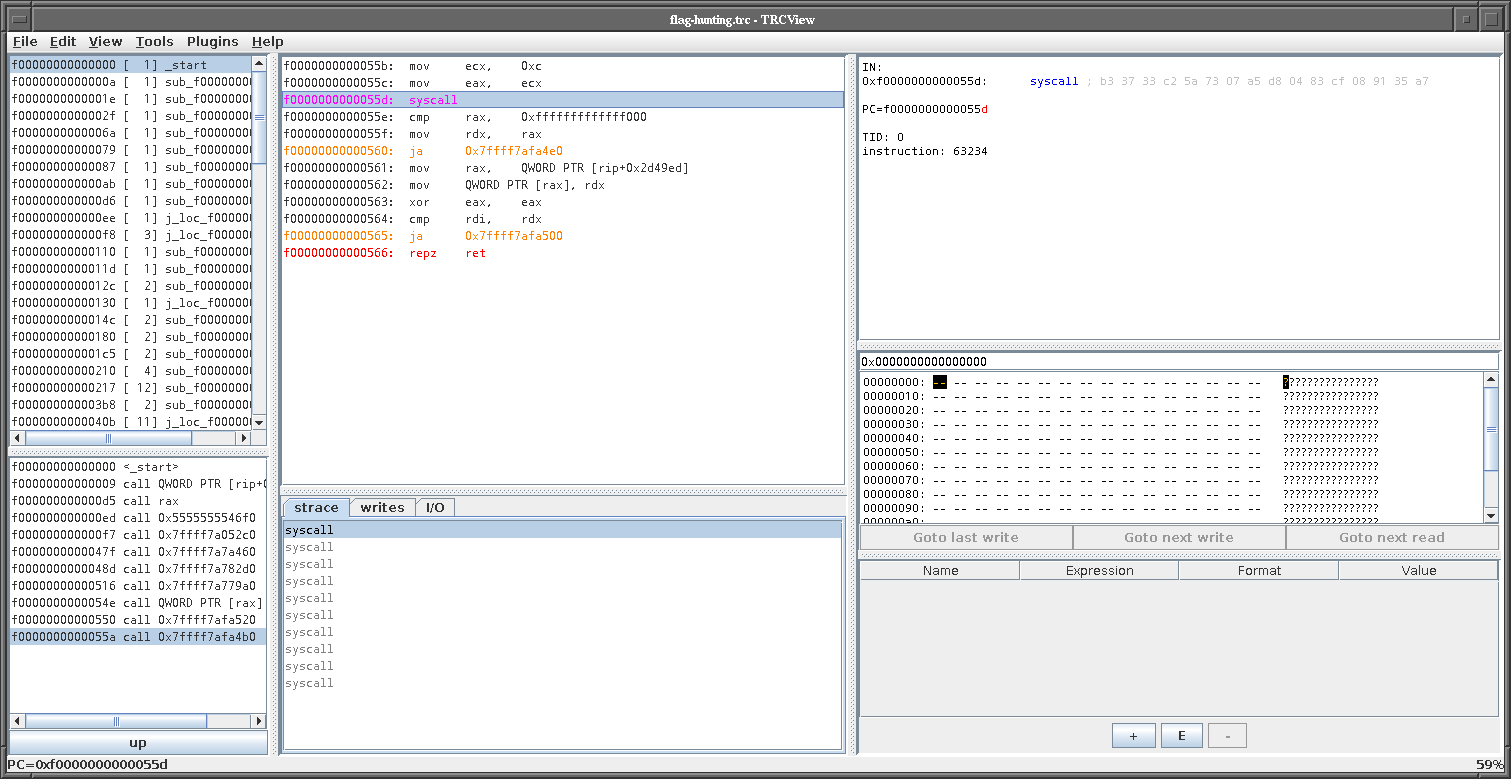
We can see the instruction moving a value of `0xC` to `eax`, which means
it is syscall 12 = `brk`. By adding `brk` as comment to the `syscall`
instruction, we see it in the strace view too. After annotating all
syscalls, we get an idea what happens over time:
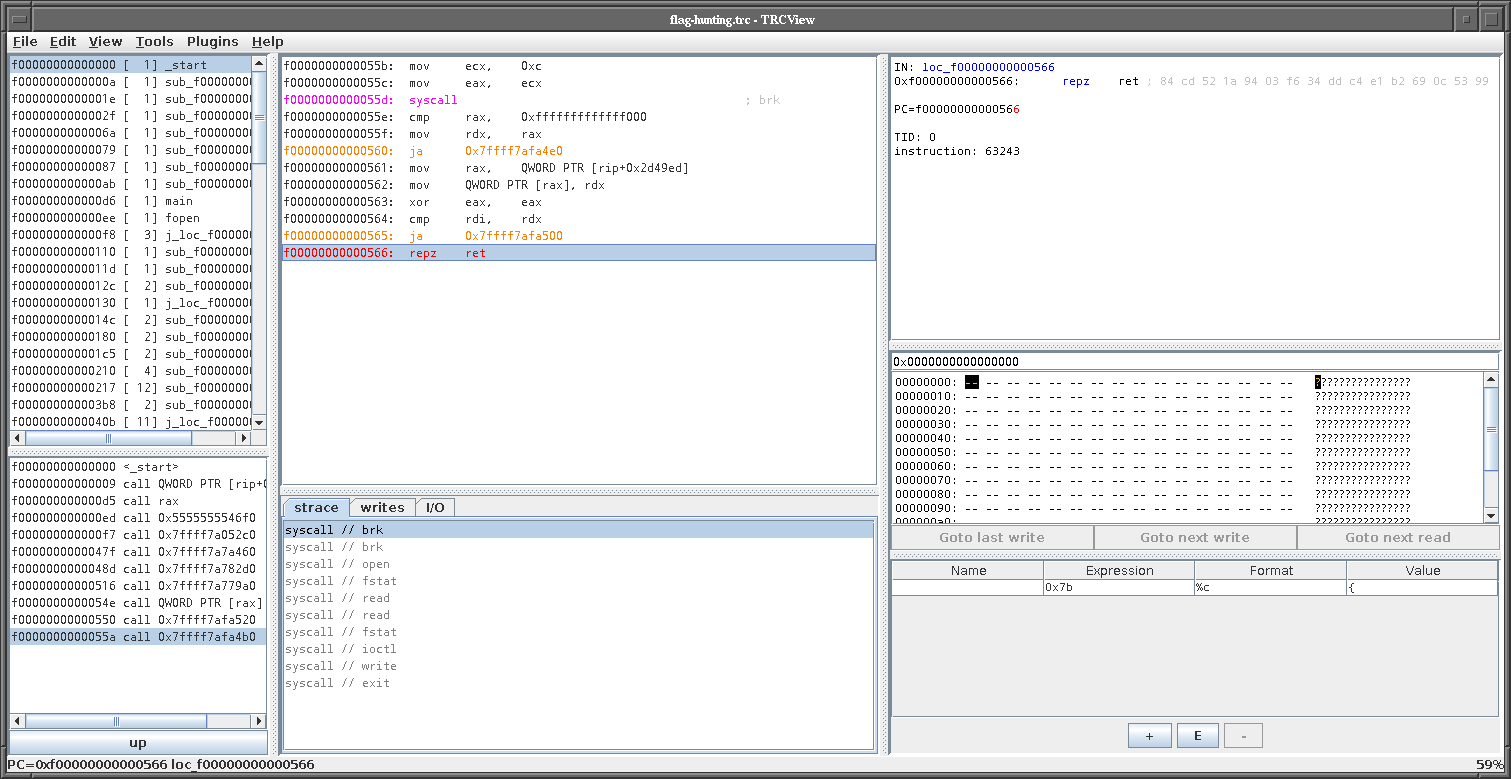
The program allocates memory, opens a file, reads content from a file,
writes to some file, and then exits. By going up the call stack from
every syscall, we can recover the libc function names. For example the
`open` syscall is eventually called from `fopen`, `read` is eventually
called from `fread`, and so on.
# The `main` function
The program's main function looks roughly like this:
```c
int main(int argc, char** argv)
{
char flag[60];
memset(flag, 0, sizeof(flag));
FILE* f = fopen(argv[1], "rt");
fread(flag, 1, sizeof(flag), f);
int flag_len = check_flag_format(flag);
process_flag(flag, flag_len);
return 0;
}
```
The two interesting functions now are `check_flag_format` and
`process_flag`. Let's look at `check_flag_format`.
# Flag Format Check
This flag format check verifies if the characters in the flag are
*valid* and at the same time it computes the flag length. Since this
code specifically checks for `O`, space, and character value ranges, we
know that the flag starts with three `O` characters, there are space
characters in the flag, and all other characters are greater than 0x60,
which means it's all lowercase letters. With this information, we can
now look at the subroutine which processes the flag.
# Processing the Flag
The `process_flag` subroutine allocates three variables, one is the
pointer to the flag buffer, the second one is a counter, and the last
one is another 64bit value initialized with NULL. The code then iterates
over all characters of the flag, and calls a function with the 64bit
value and the character from the flag. The returned value replaces the
64bit variable's value. This means the new function updates this value
somehow.
Essentially the code so far looks like this:
```c
void* ptr = NULL;
for(int i = 0; i < flag_len; i++) {
ptr = do_something(ptr, flag[i]);
}
```
Looking at the called function itself, it seems to create some data
structure. In the first invocation, it creates a new element, in later
invocations, it traverses the data structure and modifies it. Now we
know the 64bit variable in the `process_flag` subroutine is actually a
pointer to this data structure. Let's rename this `do_something` to
`insert`, because that's probably what it does.
After the loop finishes, another function is called, which turns out to
be a print function. The complete code of `process_flag` looks roughly
like this:
```c
void process_flag(char* flag, int flag_len)
{
void* ptr = NULL;
for(int i = 0; i < flag_len; i++)
ptr = insert(ptr, flag[i]);
print_data(ptr);
}
```
# The `insert` operation
In the `insert` function, the first invocation creates a new node. The
function which creates the node looks like this:
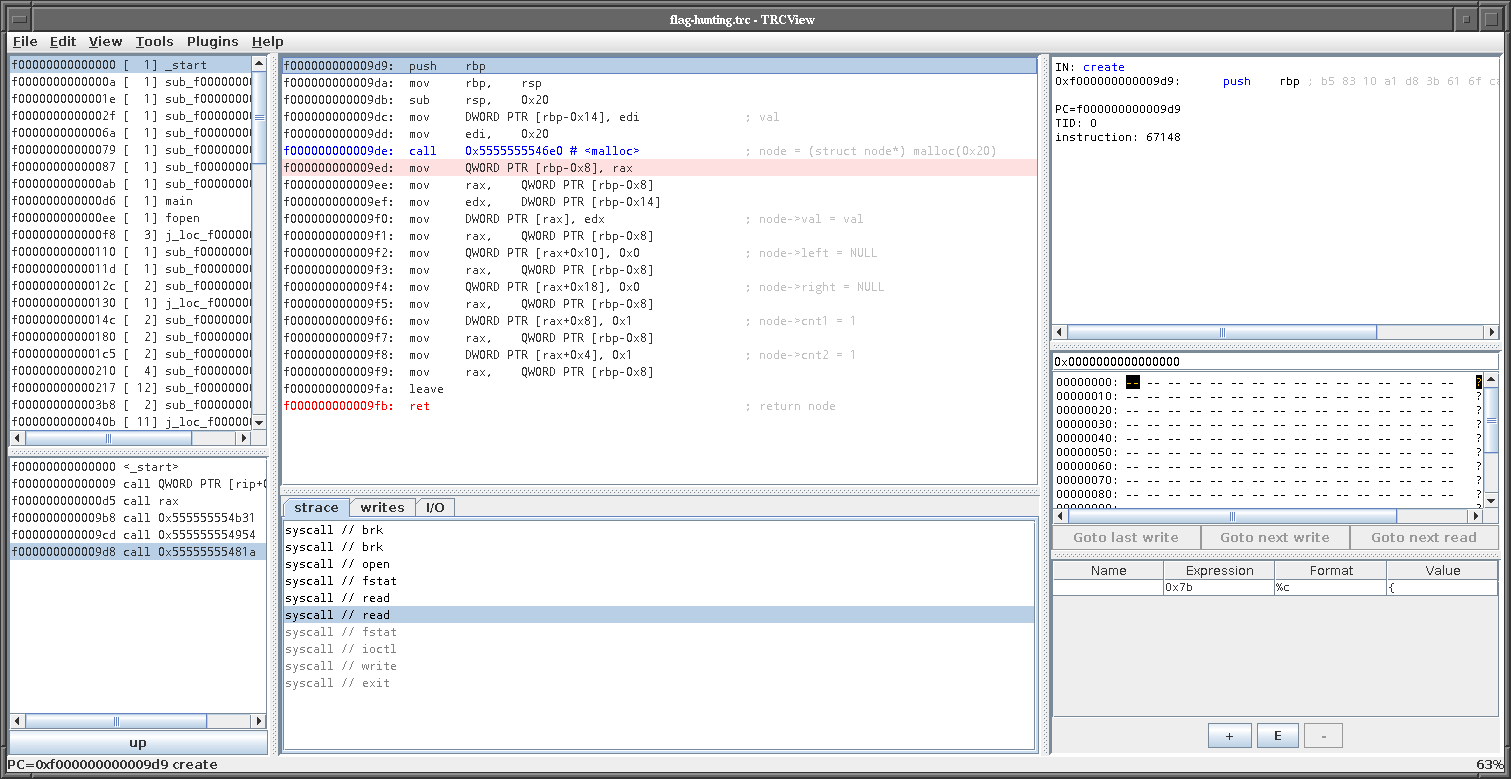
From here we learn that nodes are 32 bytes large, and have a structure
like this:
```c
struct node {
int val;
int cnt1;
int cnt2;
int pad;
struct node* left;
struct node* right;
};
```
The `left` and `right` can be inferred from the print function, which
traverses this data structure:
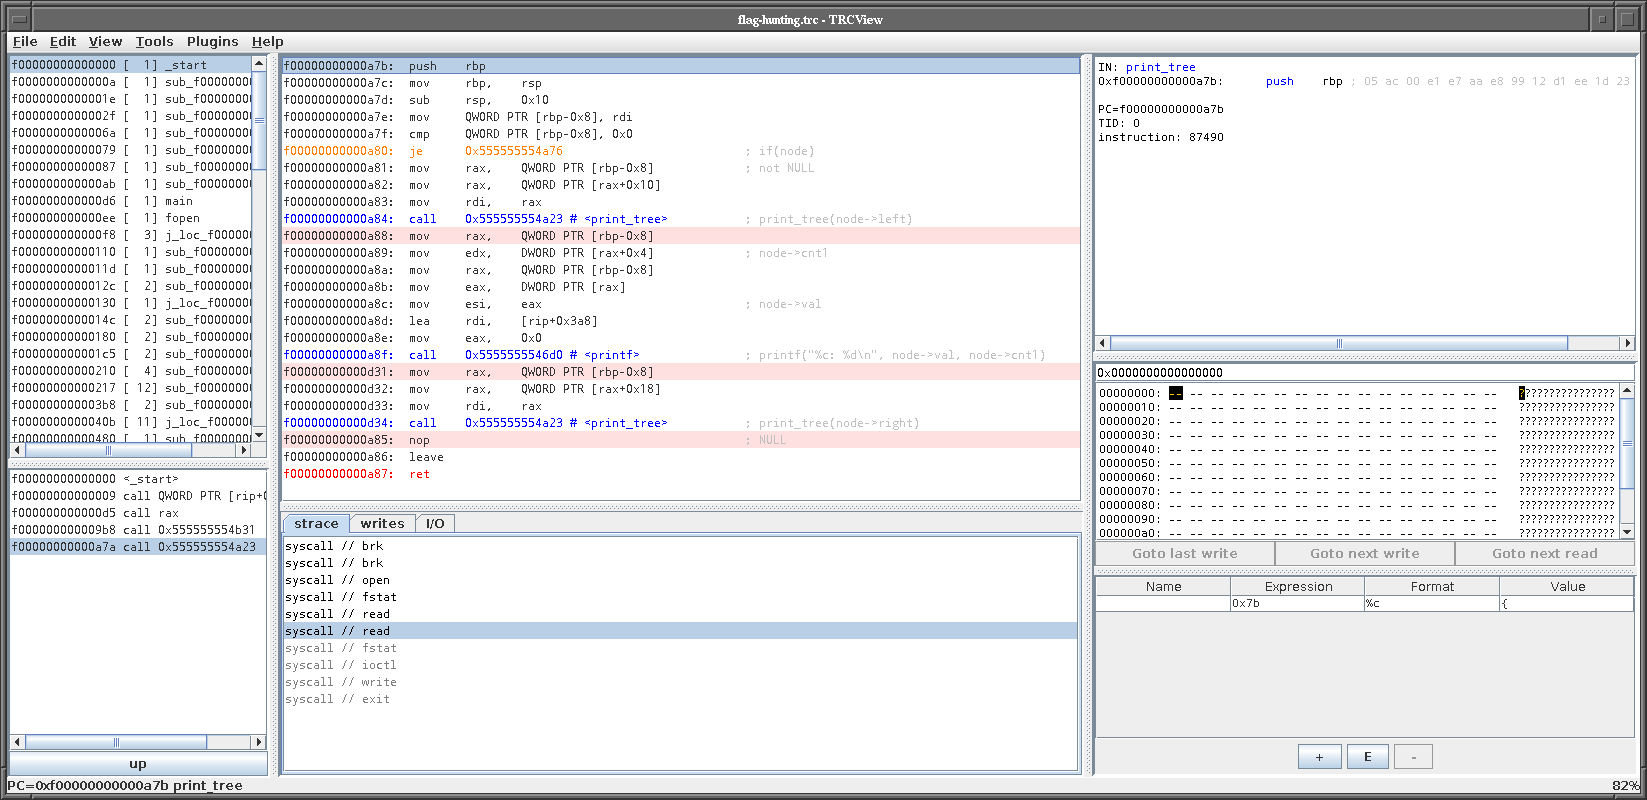
We can now safely assume it's a binary tree, with the value, a left and
right pointer, and two counters. The first counter is the number of
occurences of the character. The decompiled version of the `print_tree`
function from the screenshot looks roughly like this:
```c
void print_tree(struct node* node)
{
if(!node)
return;
print_tree(node->left);
printf("'%c': %d\n", node->val, node->cnt1);
print_tree(node->right);
}
```
Basically the `process_flag` function counts the occurrences of every
character in the flag. Although we cannot observe the values themselves,
we can observe the position of the values in the tree, and since the
flag has 21 unique characters (which can be guessed from the invocation
count of `create`), guessing the rest should be easy.
Now we have to understand the rest of the `insert` function to get the
character positions in the tree.
The first case for `insert` was to create a new node, since the passed
node was NULL. The second case for `insert` looks like this:
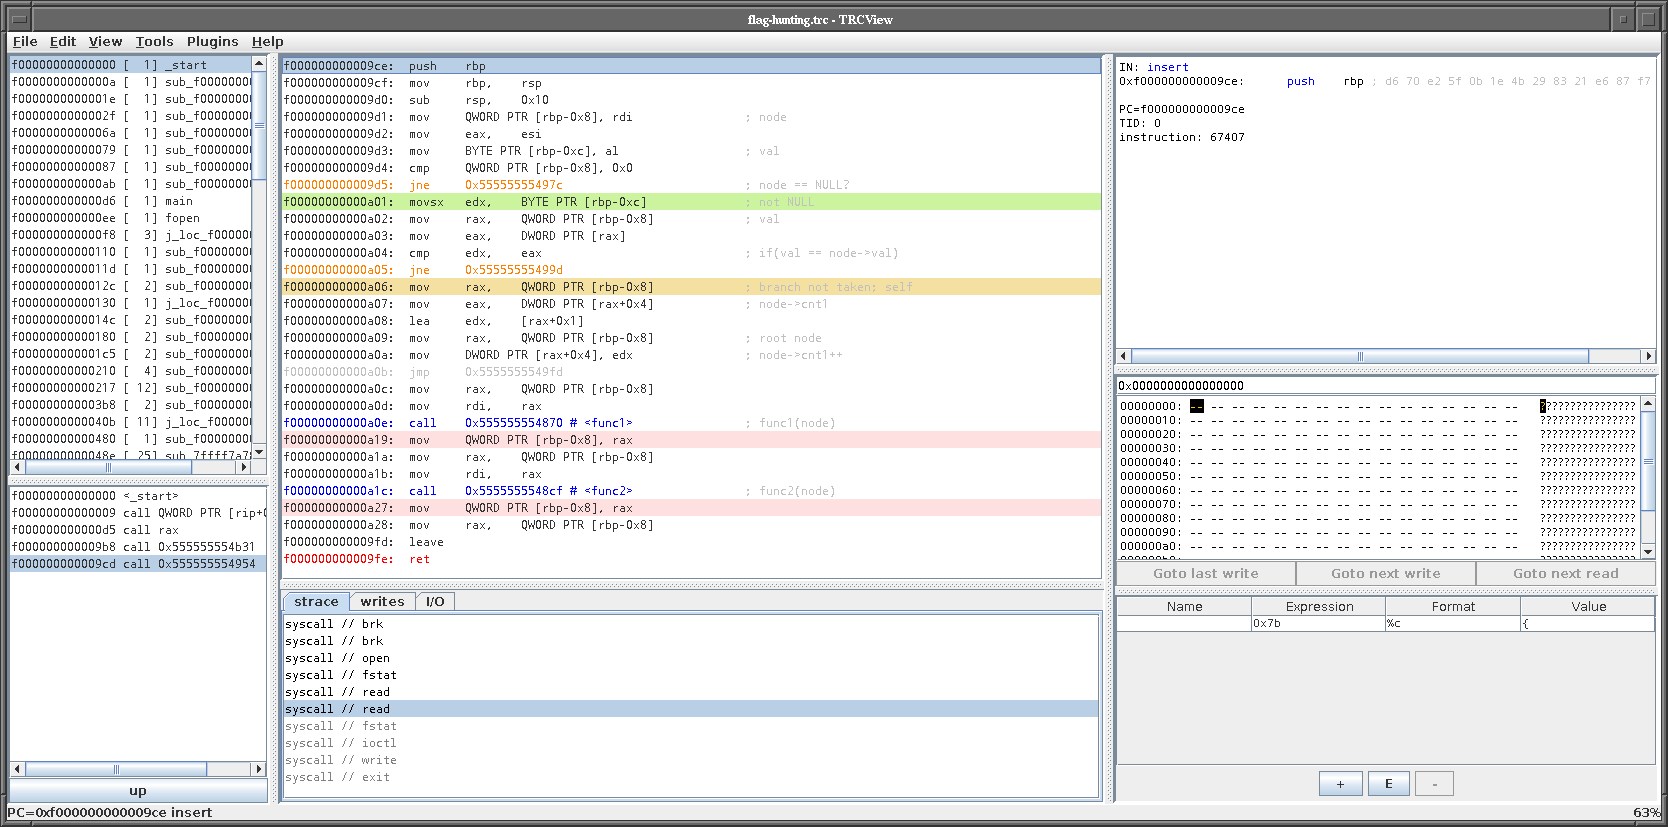
The node has the value that is to be inserted into the tree, so the
first counter is incremented. Afterwards, two functions (`func1` and
`func2`) are called, which somehow re-organize the tree. In this
specific case, they don't do anything.
The third case of `insert` is for recursively inserting into one
subtree, the fourth one recursively inserts into the other subtree. But
the question remains, what does `func1` and `func2` do? Looking at all
the invocations, `func1` seems to do this:
```c
struct node* func1(struct node* node)
{
if(node->left && node->left->cnt2 == node->cnt2) {
struct node* n = node->left;
node->left = n->right;
n->right = node;
return n;
} else {
return node;
}
}
```
The other function (`func2`) does something rather similar:
```c
struct node* func2(struct node* node)
{
if(node->right && node->right->right &&
node->cnt2 == node->right->right->cnt2) {
struct node* n = node->right;
node->right = n->left;
n->left = node;
n->cnt2++;
return n;
} else {
return node;
}
}
```
Those functions seem to re-balance the tree. Now that we know how the
tree is constructed, all we have to do is re-implement all those
functions, re-play the trace and create a tree with exactly the same
structure, but with the positions of the flag characters as content.
To do this, we write a simple python script.
# Decoding the Trace
Remember that TRCView shows the original obfuscated program counter
addresses in the "machine code" comment? This is what we need now to
decide in the python script what to do. The basic idea is to read the
trace in the python script, check for (obfuscated) program counter
values, and then perform some actions. We don't care about the actual
machine code at this point.
First of all, we read the trace file and only keep the obfuscated
program counter value:
```python
with open("trace.txt", "rt") as f:
data = f.readlines()
trace = [ int(x.split(" ")[0], 16) for x in data ]
```
Then we have to parse the trace of the `check_flag_format` function,
which reveals the flag length:
```python
def check_flag_format(trace):
i = 0
for step in trace:
if step == 0xcd97512d07efe7aa3271311a5a343e98:
i += 1
elif step == 0x9a5816982d4321860eb7bec0b5ae8d3e:
i += 1
elif step == 0xb42b799b2e1ef9ce91bf86738b6fa8fb:
return i
```
The next function is the `process_flag` function, which has to
reconstruct the tree. The tree itself has a rather simple structure:
```python
class Tree(object):
def __init__(self, val):
self.val = [ val ]
self.left = None
self.right = None
self.count = 1
self.cnt2 = 1
```
The function `func1` is rather easy to implement in python, since it
doesn't even need to look at the trace at all:
```python
def func1(node):
if node.left is not None and node.cnt2 == node.left.cnt2:
n = node.left
node.left = n.right
n.right = node
return n
else:
return node
```
The function `func2` is similar, and again, it doesn't need to check the
trace:
```python
def func2(node):
if node.right is not None and node.right.right is not None and \
node.cnt2 == node.right.right.cnt2:
n = node.right
node.right = n.left
n.left = node
n.cnt2 += 1
return n
else:
return node
```
Although those two functions don't have to check the trace, the
correctness *can* be verified by checking the trace. Since the decisions
made in the python script have to match the decisions in the trace, it's
easy to see if there are any differences.
Now the `insert` function can be recreated:
```python
def insert(trace, start, val, tree = None):
cont = None
for i in range(start, len(trace)):
if cont is not None: # continue if necessary
if cont > i:
continue
else:
cont = None
step = trace[i]
if step == 0x7e8d3d12f9987acc83634394bb225179:
tree = Tree(val)
elif step == 0x9fd18c435279a11cc106c4933676a7d9:
(_, cont, node) = insert(trace, i + 1, val,
tree.left)
tree.left = node
elif step == 0xa2648a849526903f1553126aa4119b79:
(_, cont, node) = insert(trace, i + 1, val,
tree.right)
tree.right = node
elif step == 0xb39fabb14ca48dfa222944f6b24fff4b:
tree.count += 1
tree.val += [ val ]
elif step == 0x83558aaf42e5b6c58859338ad3e67ec6:
tree = func1(tree)
elif step == 0x7dd2b7931b57d948b675c187dcdb0104:
tree = func2(tree)
elif step == 0x035619afe13a4b106de53674a406125f:
return (trace, i + 1, tree)
```
With `insert` implemented, we can now implement the function which
creates the tree:
```python
def create_tree(trace):
pos = 0
tree = None
for i in range(len(trace)):
step = trace[i]
if step == 0xca5ab312e8886c46a899368f61547e0b:
(_, _, tree) = insert(trace, i, pos, tree)
pos += 1
return tree
```
By calling `create_tree` on the trace, we get a reconstructed tree which
has the character positions of the flag characters in the `val` field of
the nodes. Now all we have to do is generate a flag out of this tree.
# Generating the Flag
We need to serialize the tree into a set of equivalent characters, which
we call *classes* from now on. Those classes represent different
characters, and the most important property is that the character values
of the classes are sorted from smallest to biggest value.
```python
def serialize(tree):
if tree is None:
return []
result = serialize(tree.left)
result += [ tree.val ]
if tree.right is not None:
result += serialize(tree.right)
return result
```
Getting the classes is now easy:
```python
tree = create_tree(trace)
classes = serialize(tree)
```
Now we can assign character values to every class. For the first two
classes we already know the values: space and `O`. The last class is the
`{` character.
```python
values = [ '.' ] * len(classes)
values[0] = ' '
values[1] = 'O'
values[-1] = '{'
```
Unfortunately the character values are not `value[i] = x + i`, but
instead there is a "gap" between some character values. This is what we
have to guess. Solving the challenge is now about guessing those "gaps":
```python
skip = [ 0 ] * len(classes)
skip[7] = 2
skip[9] = 2
skip[14] = 1
skip[19] = 2
off = 0
for i in range(2, len(classes) - 1):
off += skip[i]
values[i] = chr(0x60 + (i - 1) + off)
flag = [ '}' ] * len(flag_format)
for i in range(len(classes)):
for n in classes[i]:
flag[n] = values[i]
print("".join(flag))
```
The complete solve script is available here: [solve.py](https://www.sigflag.at/assets/posts/flag-hunting/solve.py)
Running this script reveals the flag:
```
OOO{even my three year old boy can read this stupid trace}
```
# Other Observations
- The program was probably compiled with `-O0`, since many useless load
and store operations can be observed.
- The program is dynamically linked, since GOT/PLT based calls can be
observed, and two different address ranges are in use.
- The program was probably traced with a debugger, because the address
range of the program code starts with 0x5555...
- The dynamic linker cannot be observed at any time, which indicates
that all functions were resolved before the trace recording started.


